Geographical Information Systems
Geographical Information Systems (GIS) guide us to solutions to problems when we have data that can be mapped over geographical regions.
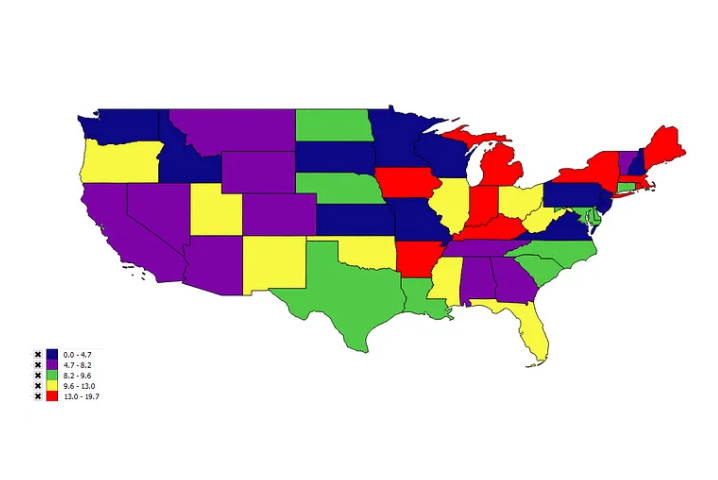
Think about crime rates over national or local geographical regions. GIS can guide us as to where the big problems are and to where we should deploy resources to reduce the crime rate.
Geographical Information Systems not only guide us, but give us clues as to how to solve problems. By mapping different layers of data (zip code over census tract or city council over over crime districts), for example, we can make data-driven decisions on where to deploy resources to reduce crime or reduce poverty or increase business development.
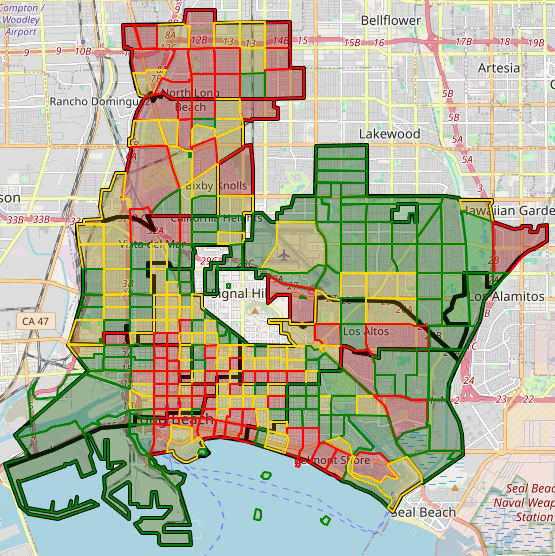
The geographical information systems that we use display "hotspots" of high crime areas (as shown) or other demographic or behavorial information.
These maps allow city officials and businesses to see the areas of opportunity to further enforce the law or to provide a new business.
We utilize Python and its GIS modules to do our work because we cannot afford the prices that ESRI ArcGIS of $700 costs per year (minimum). This gives our developers and the community the ability to tailor our cheap and accurate GIS analysis for our specific needs rather than being stuck with expensive ESRI ArcGIS tools.
We find that the open-source community of Python developers can figure out ANYTHING. And help us solve our problems.
GIS can show us hotspots. But what else can we learn? And what other actions can we take?
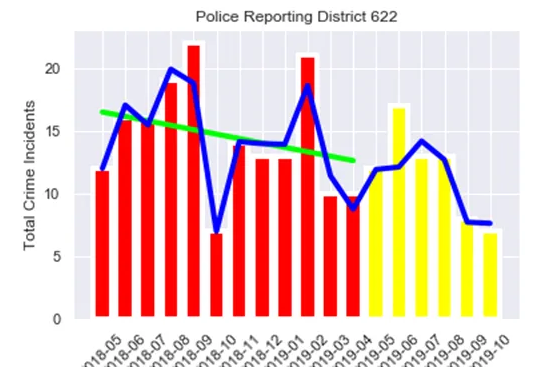
The current displays shows that GIS can guide us to hotspots to take action on, but we can utilize other non-GIS algorithms to try to predict future behaviors.
The display shows some learning that takes place over the last few months of crime data and then tries to predict future months of crime levels. If vetted and approved, this could give police an opportunity to best deploy resources where they expect crime to increase.